
Trading should merely be a straightforward procedure of buying cheap and selling high but for many investors, the process is more similar to rocket science. One of the most simple and easy-to-understand tactics that can help accomplish this is to identify an asset’s support and resistance levels.
Once traders can spot the support and resistance levels, they may enhance their entry and exit timing in the market. Support and resistances are also beneficial during bullish, negative, and range-bound markets.
Being familiar with how support and resistance work is a must for developing an effective trading strategy. The basic trading idea of buying at support (a low price) and selling at resistance (a high price) needs that the two concepts to be understood to earn from trading.
However, there is a need to look at how support and resistance affect your trades.
What Is Support?
At this point, the negative trend is predicted either to be temporarily halted or to turn around entirely. When a cryptocurrency is undervalued, purchasers want to buy it at a lower price.
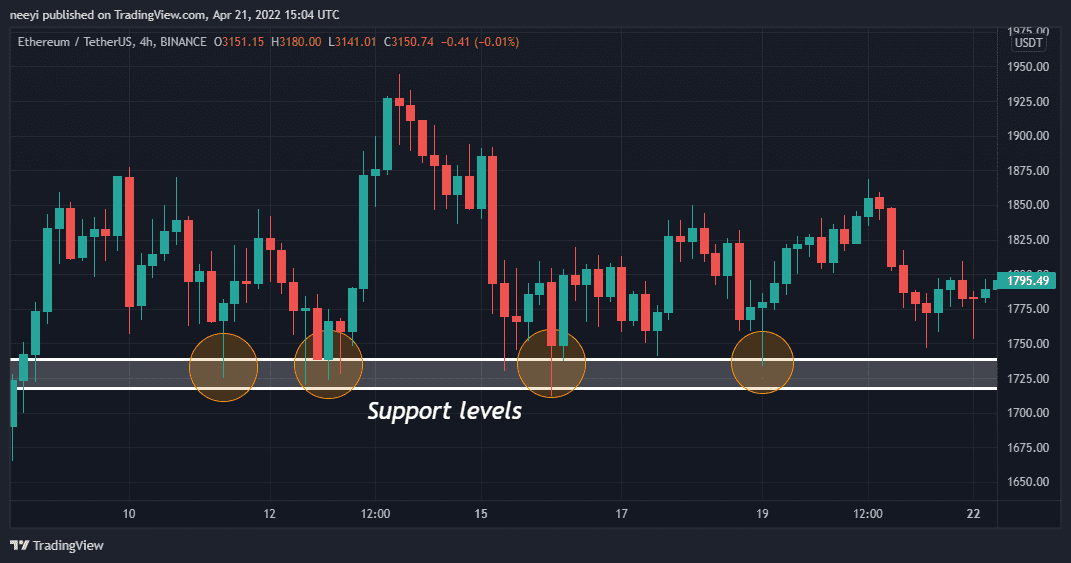
There is a tendency for buyers of Bitcoin (BTC) to want to maintain their positions at a price Y and if the price Y returns, they may add to their positions. Because they were able to keep the price of BTC from falling below price Y in the first place, purchasers will view this as a safe level from which to add additional buy pressure. Support, which is touted as the temporary barrier is formed because of the price’s resistance to further decline due to the buyer demand.
What Is Resistance?
Any time an upward or bullish trending price movement encounters resistance, the trend is likely to reverse. There are usually a lot of sell orders at the resistance level.
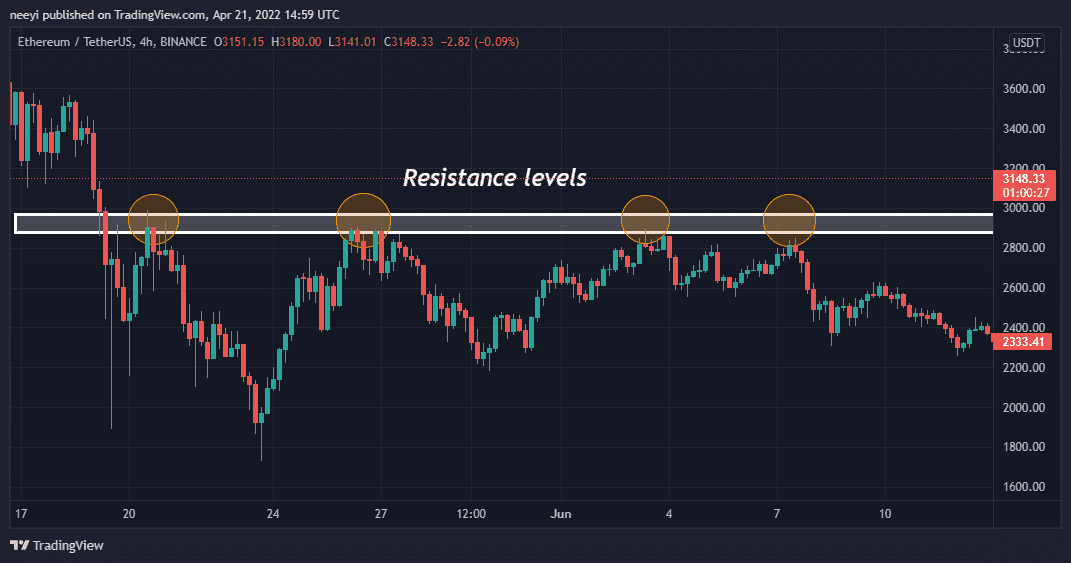
Sellers strive to take advantage of an asset’s overvaluation when it is at its peak. Buyers, on the other hand, would begin to hunt for ways to extract their profits. At this price, some of them may even consider selling. Selling pressure creates a barrier similar to that formed by buying pressure, which is commonly referred to as resistance.
Often than not, the price is a function of support and resistance. Also, support and resistance levels are represented by lines, even if the lines are in abstract form. As opposed to straight lines, it is more useful to think of support and resistance as a price range on a chart that works as a barrier.
How To Identify Support And Resistance
The price chart of a cryptocurrency can be used in a variety of ways to identify areas of support and resistance.
1. Round Number (Psychological Support And Resistance)
For this reason, round numbers are often used as levels of resistance and support. For this reason, they are frequently referred to as psychological support and resistance zones, as they don’t necessarily connect with any chart patterns.
Many of us would rather pay $25 or $40 for a product than $24.74 or $39.68. It is because of this predilection that we like to place orders in the form of multiples of 10. To keep prices down, additional orders are needed at these stages. When the price of a crypto token is decreasing to $40, a large number of buyers could act as a wall of support by executing a buy order at $40.
2. Moving Average
Indicators like moving averages are used by traders to determine support and resistance. Support or resistance to the price is provided by this. For example, a moving average can be used to identify a turning point in the market’s trend.
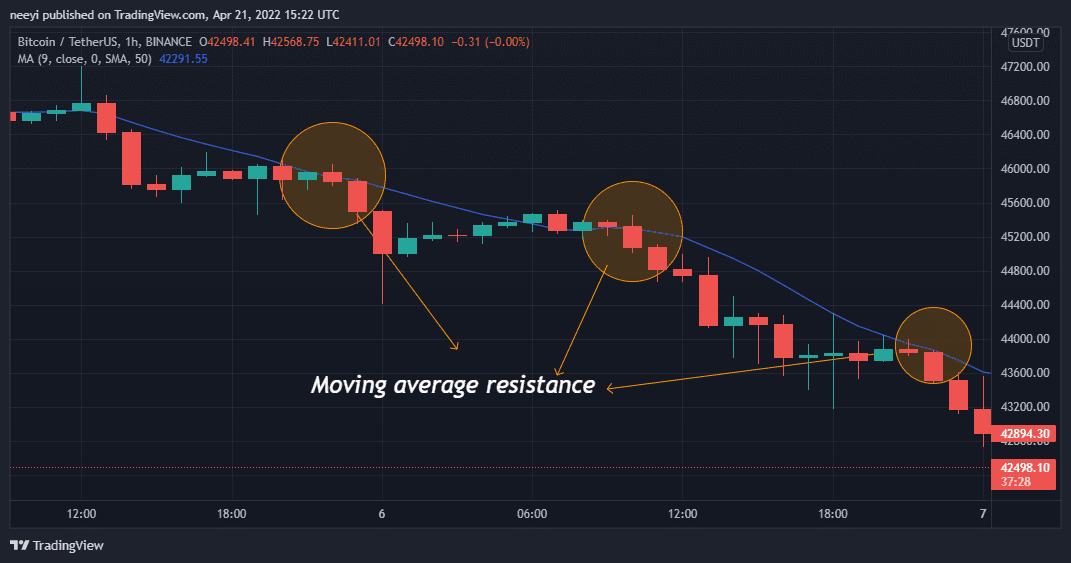
At several times in the graph, the price of gold has deviated from the moving average. In this scenario, it aids in the discovery of critical points of resistance.
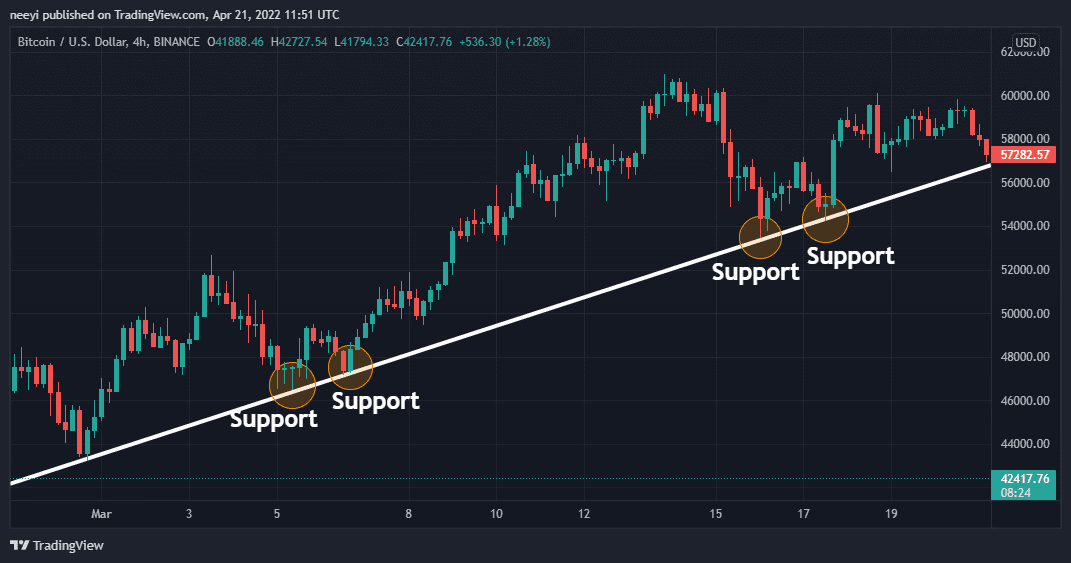
3. Trendline
In trending markets, a trendline is extremely beneficial. For instance, it points up regions of support and resistance.
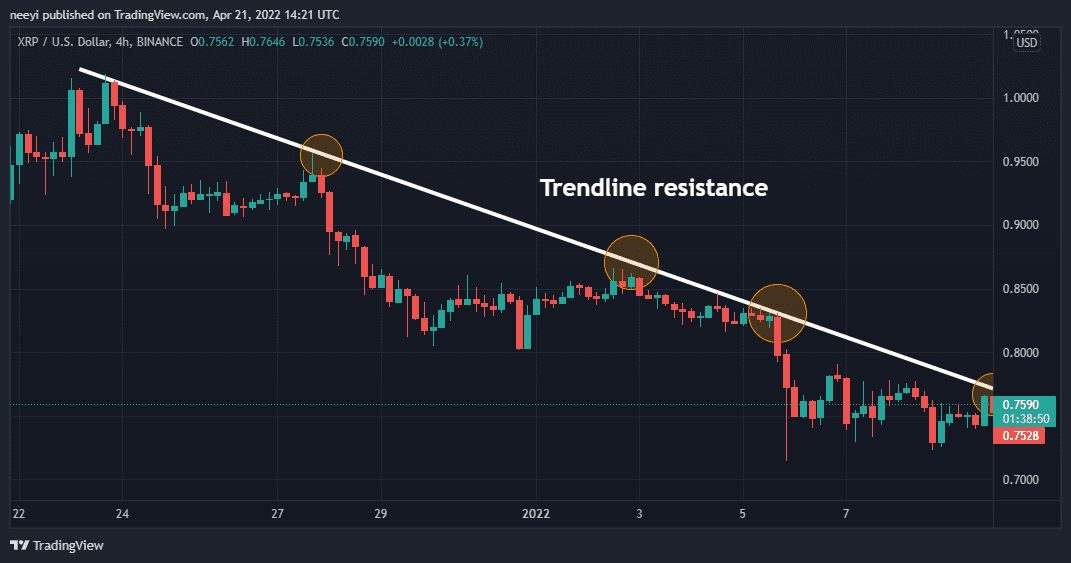
After bouncing off its trend line, the price presents a selling opportunity at each of these points on the chart. To make an order, traders would only need to seek additional confirmations.
How To Trade Support And Resistance
To trade support and resistance, there are several methods available. You can get several different responses from traders on how they trade support and resistance. For the most part, traders simply do two things when it comes to supporting and resistance: they place trades when the market breaks out or bounces back.
1. After A Breakout
Breaks in support and resistance levels are common. There are trading possibilities to be had when a market breaks out of a certain price range. Until we are confident the price has breached the points, all we can do is wait for additional confirmations, and then we will try to find an entrance.
A price breakout may lead to a pause before the price continues on its path. When support is broken, a pullback is possible; some traders refer to this as a ‘retest.’ Afterward, the price retraced to the previous support level, which would have been resistance.
To enter a trade, we can wait for a decline and then look for evidence that it is time to buy. Some traders, on the other hand, take a more aggressive approach by jumping in immediately after a breakout.
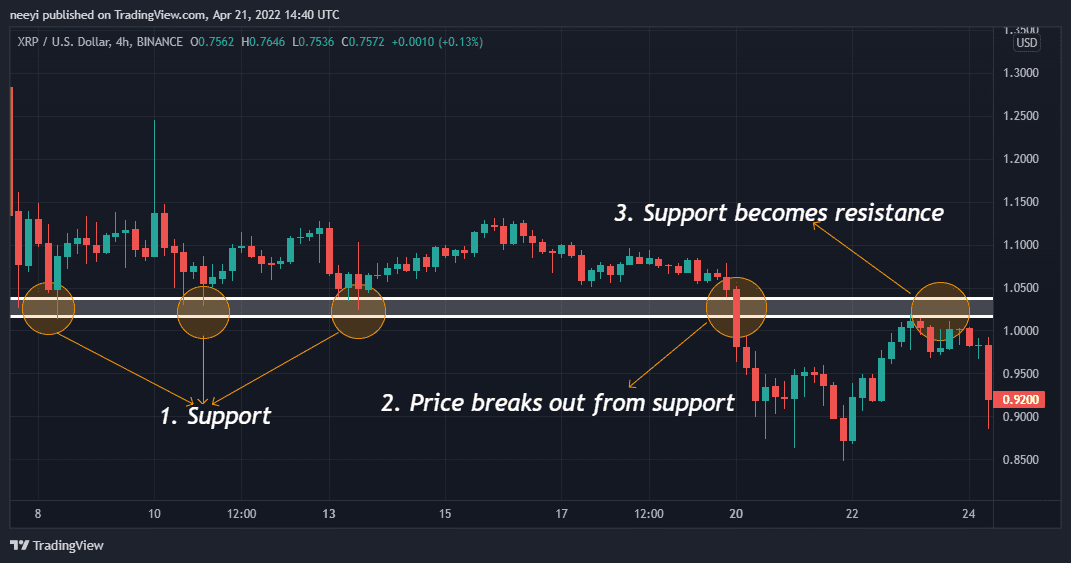
Support zones that were previously broken in an uptrend now serve as a retracement point for the price. In a downtrend, the broken support serves as a barrier that is anticipated to keep the price in check.
2. After A Bounce
Waiting for a price bounce and receiving confirmation before placing an order is a common strategy for trading with resistance and support in mind. You may want to wait for the price to reverse and then look for some form of confirmation before making a decision.
Why bother waiting for confirmation? Because not all of the support or resistance will hold, you will need a second opinion. Before taking a position, it is always best to double-check the odds. Rather than assuming that the price would automatically rebound off our support or resistance level, we want to witness it bounce off and gain additional information before making a trade.
Conclusion
When price trends come in contact with support or resistance lines, they are expected to take a breather because of the concentrated buying or selling pressure that awaits. A barrier to price movement may endure for a long time, but it will eventually be broken down by the market.